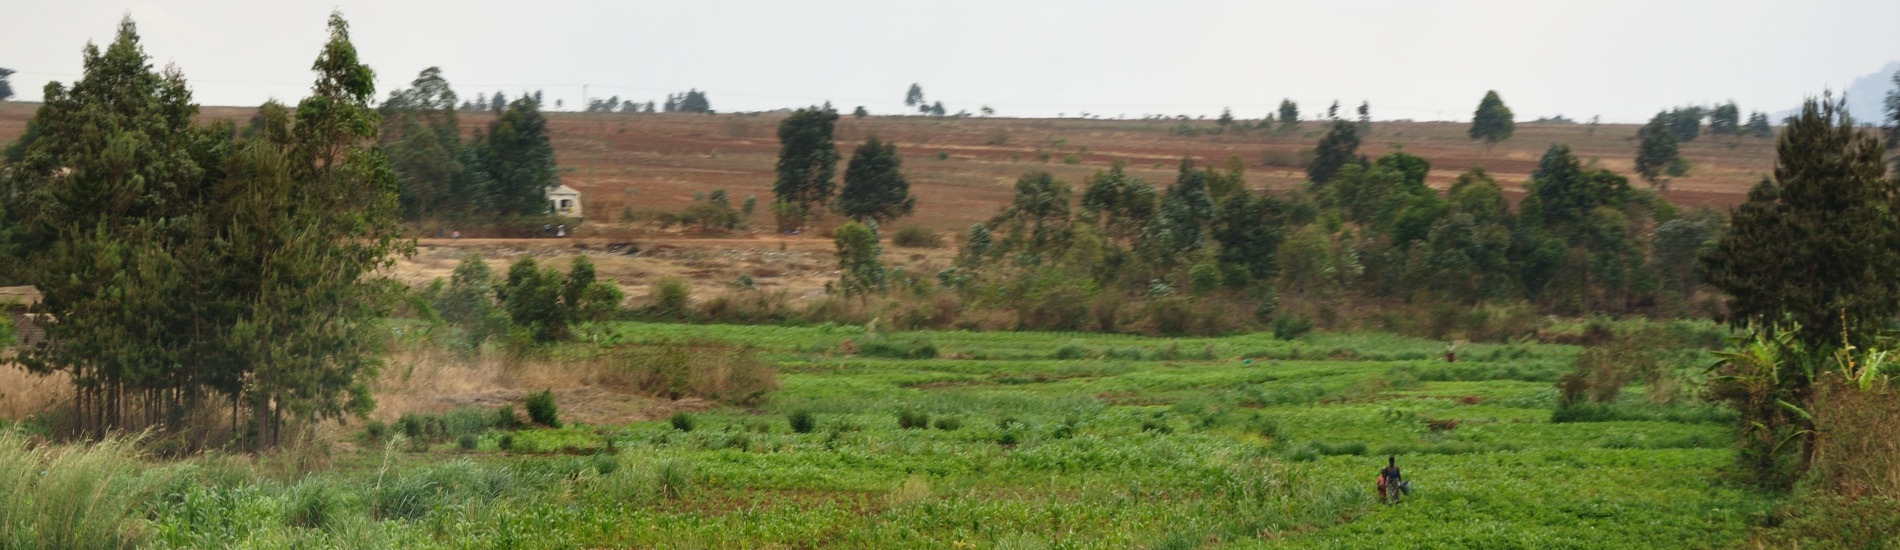
The APSAN-Vale Flying Sensor portal, part of the APSAN-Vale project to show outcomes of the project to the public, has received a major update with some new and very useful functionalities. The project, which started in 2018, is piloting innovations to increase the water productivity and food security for climate resilient smallholder agriculture in the Zambezi valley of Mozambique. It will demonstrate what the best combinations are of adoption strategies and technological packages, with the largest overall impact in terms of water productivity, both at the plot-level, sub-basin as well as basin-level.
The main role of FutureWater is monitoring water productivity in target areas using an innovative approach of Flying Sensors (drones), a water productivity simulation model and field observations. Flying sensors provide high resolution imagery, which is suitable for distinguishing the different fields and management practices existent in smallholder farming. For this purpose, a local team of FutureWater flying sensor operators, have been trained at the end of 2018. Ever since, the operators perform regular flights over farmers’ fields using flying sensors that have cameras which can measure the reflection of near-infrared light, as well as visible red light. These two parameters are used to calculate the crop performance, resulting in maps showing the vegetation status (the greener the color, the better the crop is performing), with a resolution of about 2 cm/pixel. This information is used both for monitoring the water productivity of the selected fields and determining areas of high or low water productivity. Information on the spatial variation of water productivity can assist with the selection of technical packages to introduce and implement in the field.
About the portal
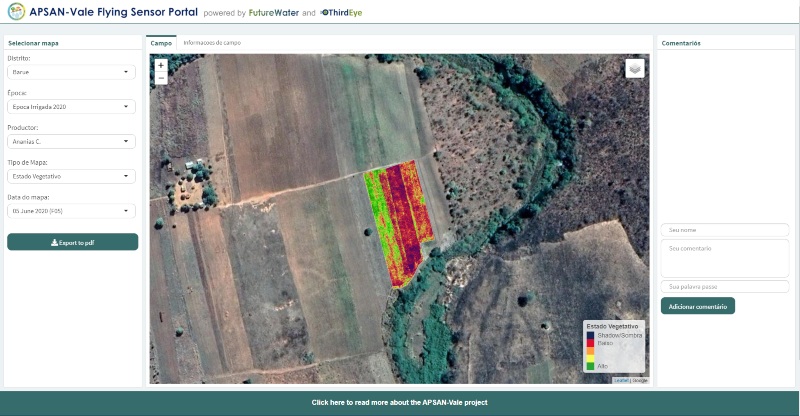
The APSAN-Vale Flying Sensor portal contains most of the flying sensor data collected within the APSAN Vale project. Flying sensor maps are uploaded to the portal automatically after they have been processed by the local FutureWater operators. In this way, the operating team can easily access the maps in the field to observe areas of higher or lower water productivity, by using a tablet, laptop or smartphone. Also, field agents of project implementing partners Resilience and HUB can access the maps in-field to provide useful advisory to farmers to prevent crop loss and increase their water productivity. Farmers are also able to view the maps themselves and alter their farm management decisions.
Updates
The newly updated portal consists of some very useful new information and options:
- It now has a “Export to PDF” button which will automatically generate a PDF-file with a screenshot of the map that is loaded, including the comments, information about the farm and a weather forecast for the next 7 days. This is very useful for operators to bring to the farmers to also help them with their farm management.
- As mentioned above, the portal now contains a new page (tab) with information of the farm. Information consists of planting date of crops, crop types, field numbers and name of the farmer. It is not only possible to just view the information, but also the latest information can be added to the portal! This makes it possible for the portal to be potentially used as a small database for each farm where all the necessary information is stored.
- Water productivity maps of the 2019 rainfed season are now included, showing the water productivity and water productivity increase of the different farm and fields in this season.
- High resolution RBG images are now also included in the portal. These aerial images have a resolution of 20 cm, much higher than the average satellite imagery available.
- The latest available processed data is added to the portal.
Future plans
For now only images of the past growing season have been added to the portal. Soon, the following improvements will be made to the portal:
- All images taken and (water productivity) maps made during the complete project period will be added.
- Apart from the Vegetation Status, Visual flying sensor images and Water Productivity maps, canopy cover maps will also be added.
- The portal will be continuously tested in the field in Mozambique.